Fused Softmax & CUDA Kernels
I built online softmax and three versions of matrix multiplication to see how memory access and data reuse change GPU performance. Here is what I implemented and measured on my RTX 3070.
What I built
I built two small GPU workloads that make performance decisions easy to see: a softmax kernel and a sequence of matrix-multiplication kernels. I kept the math fixed and changed how the work moves through the GPU. That gave me a concrete way to compare a straightforward implementation with versions that reuse more data.
For the measurements on this page, I used my RTX 3070, CUDA C++, and cuBLAS as the matrix-multiplication reference. I kept the benchmark code alongside the kernels so the results can be reproduced instead of leaving a chart with no explanation of how I timed it.
How I put the softmax together
Softmax needs a row maximum, a sum of exponentials, and a final normalization. Computing exp(x) directly is a bad starting point for large inputs, so I track a running maximum and rescale the running sum whenever that maximum changes. Each thread builds its own pair of accumulators; the block then combines those pairs in shared memory.
I use 256 threads per block and assign one block to each row. The final pass writes the normalized values. Everything happens in one kernel launch, but the input is read twice. That distinction matters when I report bandwidth: the figure uses 8 bytes per element for an effective read-plus-write rate, rather than claiming to measure every byte of physical memory traffic.
The shape changes the result quite a bit. At 2,048 columns, I measured 318.755 GB/s. At 65,536 columns, that fell to 117.364 GB/s. The widest test also has only 32 rows, so it exposes much less block-level parallelism. I would need profiling to separate that effect from register, memory, and scheduling costs; timing alone does not tell me which one dominates.
How I changed the matrix multiplication
I started with one output element per thread and a direct loop over the shared dimension. It is easy to inspect, but neighboring threads repeatedly fetch overlapping input values. The next version loads 16 × 16 tiles into shared memory, synchronizes the block, and reuses those tiles for the dot products.
For the third version, I moved to a 64 × 64 output tile and gave each thread a 4 × 4 set of accumulators. That makes each loaded value contribute to more output elements before I fetch the next tile. I also kept bounds checks in the kernels, so the implementation works when the matrix size is not a multiple of the tile size.
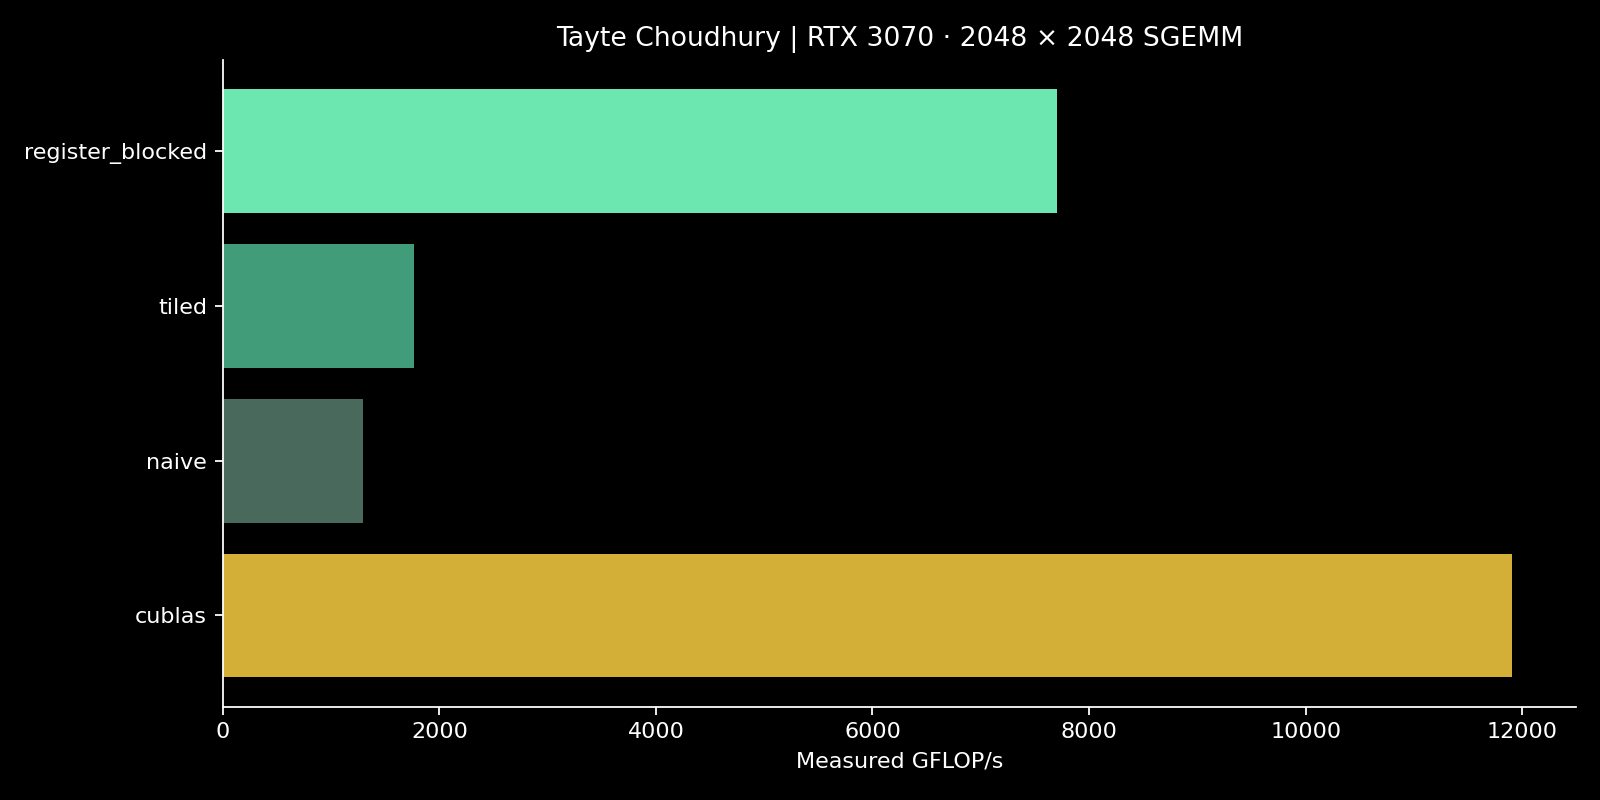
On 2,048 × 2,048 matrices, the naive kernel took 13.278 ms, the shared-memory kernel took 9.716 ms, and the register-blocked kernel took 2.231 ms. That is a 5.95× improvement from the first version to the third. The register-blocked result was 7,699.679 GFLOP/s, about 64.7% of the cuBLAS throughput in this run.
The smaller cases keep that result in perspective. On a 65 × 65 matrix, my register-blocked kernel took 0.011259 ms, while the shared-memory version took 0.006445 ms. More reuse is useful, but a larger tile is not automatically a better choice for a tiny workload. I would use shape-dependent dispatch before treating one kernel as the default for everything.
How I checked the results
I compare softmax with a double-precision CPU calculation and compare every matrix output with cuBLAS using pedantic FP32 math. The matrix tests include sizes 65, 256, and 2,048; the 65 case is there to exercise the edges of the tiles. The largest absolute softmax error was about 1.46 × 10⁻⁸, and the largest matrix error across these runs was about 9.06 × 10⁻⁶.
For timing, I run three warmups and average twenty repetitions using CUDA events. Allocation and host-to-device transfers are outside the timed region. That makes this a kernel benchmark, not an end-to-end application benchmark. These inputs are finite; I have not implemented special NaN or infinity behavior.
What I would work on next
The next useful step is to profile the wide-row softmax and the register-blocked GEMM with Nsight Compute, then test more shapes and input distributions. I would also add a PyTorch integration and measure the overhead of calling the kernels from an actual workload. Neither is part of the results here yet. The current benchmark is a starting point I can inspect and rerun, with the remaining gap to cuBLAS made explicit.
Full benchmark
| kernel | rows | columns | ms | GB_s | GFLOP_s | max_abs_error |
|---|---|---|---|---|---|---|
| online_softmax | 8192 | 128 | 0.05801 | 144.607 | 0 | 1.46414e-08 |
| online_softmax | 2048 | 512 | 0.02688 | 312.076 | 0 | 3.61611e-09 |
| online_softmax | 512 | 2048 | 0.026317 | 318.755 | 0 | 9.76077e-10 |
| online_softmax | 128 | 8192 | 0.034918 | 240.235 | 0 | 2.38919e-10 |
| online_softmax | 32 | 65536 | 0.14295 | 117.364 | 0 | 5.12953e-11 |
| cublas | 65 | 65 | 0.008346 | 0 | 65.813 | 0 |
| naive | 65 | 65 | 0.008909 | 0 | 61.653 | 0 |
| tiled | 65 | 65 | 0.006445 | 0 | 85.224 | 0 |
| register_blocked | 65 | 65 | 0.011259 | 0 | 48.782 | 0 |
| cublas | 256 | 256 | 0.01315 | 0 | 2551.59 | 0 |
| naive | 256 | 256 | 0.033331 | 0 | 1006.7 | 9.05991e-06 |
| tiled | 256 | 256 | 0.027187 | 0 | 1234.2 | 9.05991e-06 |
| register_blocked | 256 | 256 | 0.021088 | 0 | 1591.16 | 9.05991e-06 |
| cublas | 2048 | 2048 | 1.44348 | 0 | 11901.7 | 0 |
| naive | 2048 | 2048 | 13.2782 | 0 | 1293.84 | 0 |
| tiled | 2048 | 2048 | 9.71556 | 0 | 1768.28 | 0 |
| register_blocked | 2048 | 2048 | 2.23124 | 0 | 7699.68 | 0 |